
Mobility Intelligence system
Transforming complex traffic data into actionable insights:
Created a user-friendly platform that enables urban planners and engineers to make data-driven decisions effortlessly.
OVERVIEW
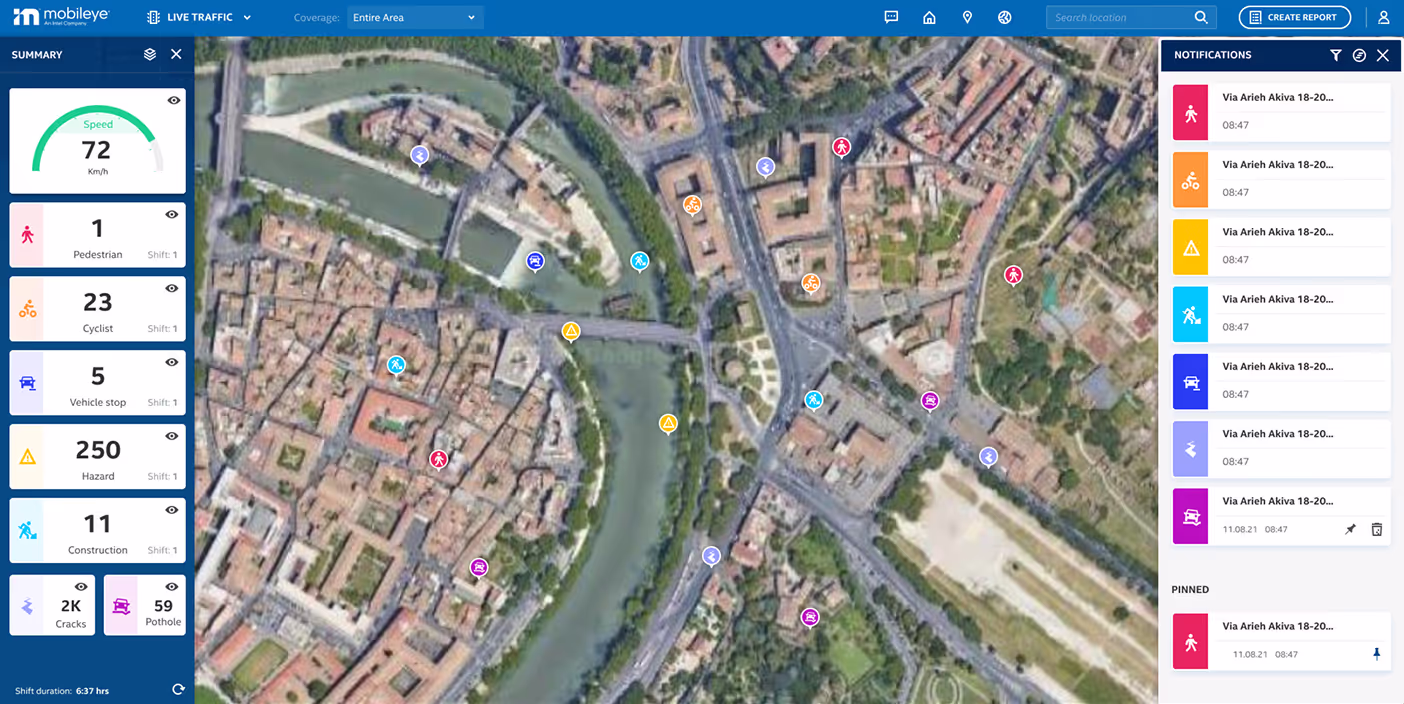
Mobility Intelligence is an advanced data visualization platform developed by Intel’s Mobileye to enhance urban mobility and road safety. The system provides real-time insights by analyzing traffic patterns, accident risks, and road infrastructure conditions.
My role was to design an intuitive, data-driven interface that enables users—urban planners, traffic engineers, and transportation experts—to make informed decisions efficiently.
Challenges

Complex Data Presentation
The system needed to display vast amounts of geospatial and analytical data without overwhelming the user.
User Accessibility
The interface had to be intuitive for non-technical users while still providing deep analytical capabilities for experts.
Seamless Navigation
With multiple layers of information (traffic conditions, risk scores, pedestrian and cyclist data), navigation had to be fluid and efficient.

Solution
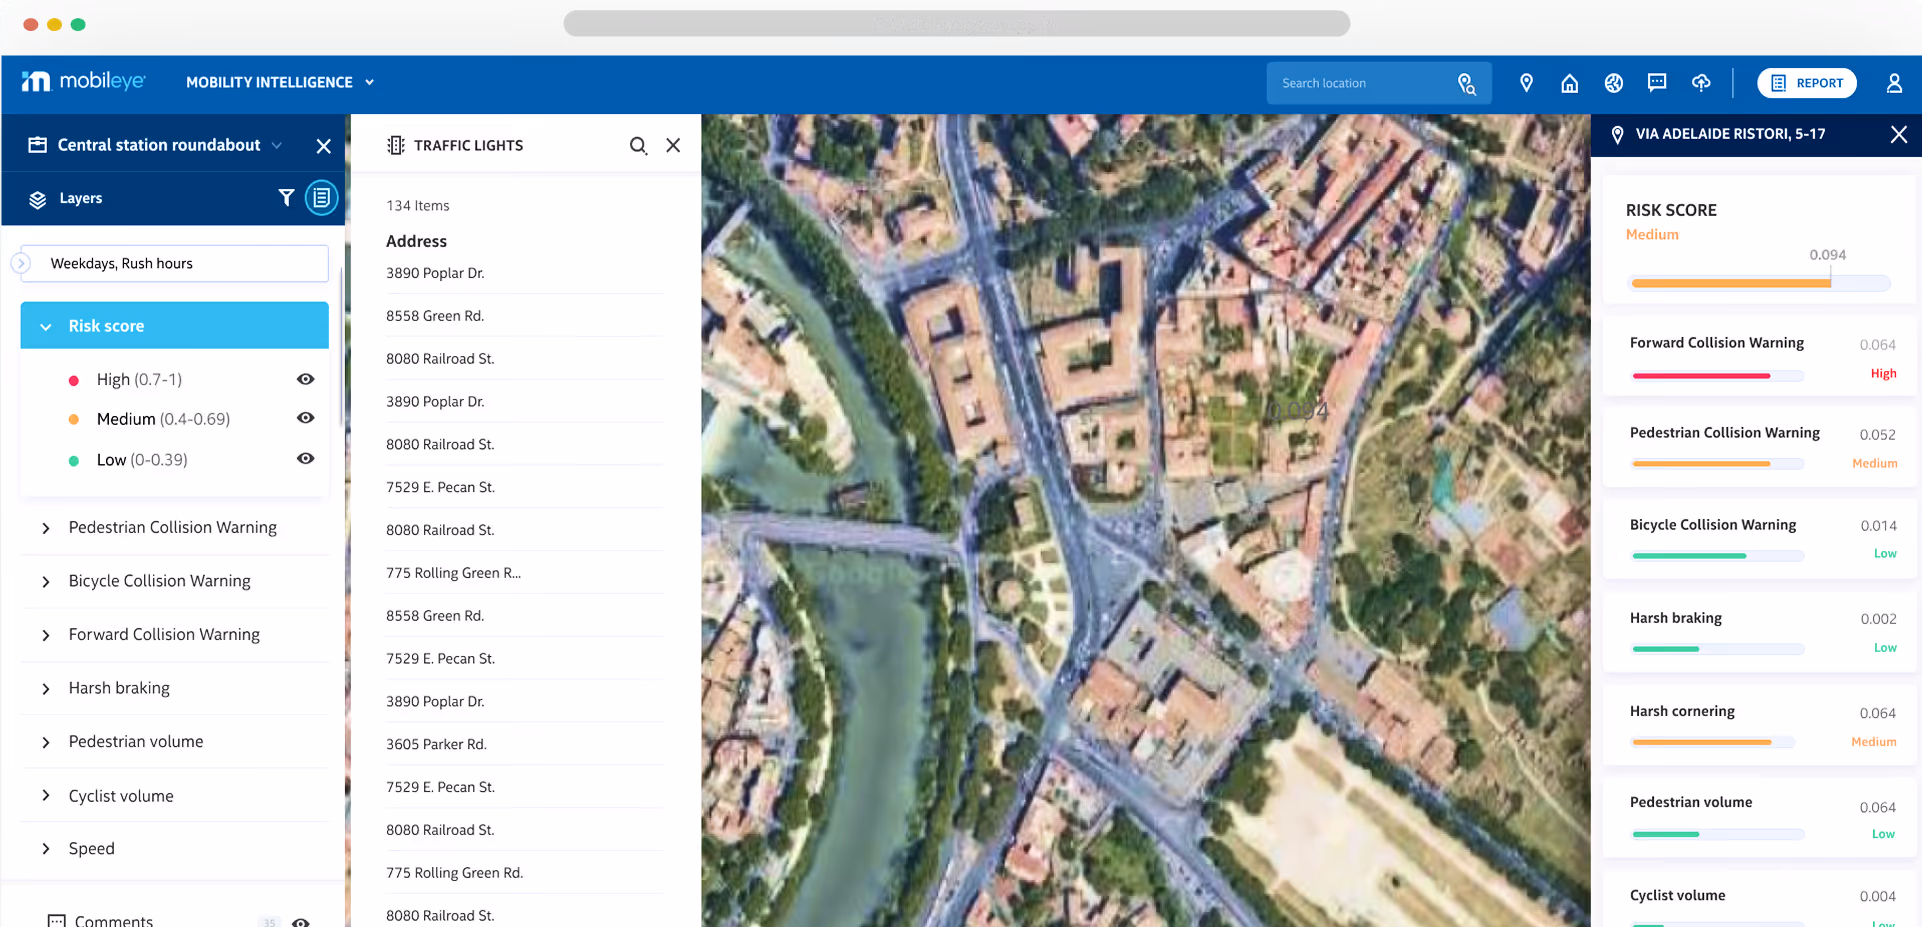
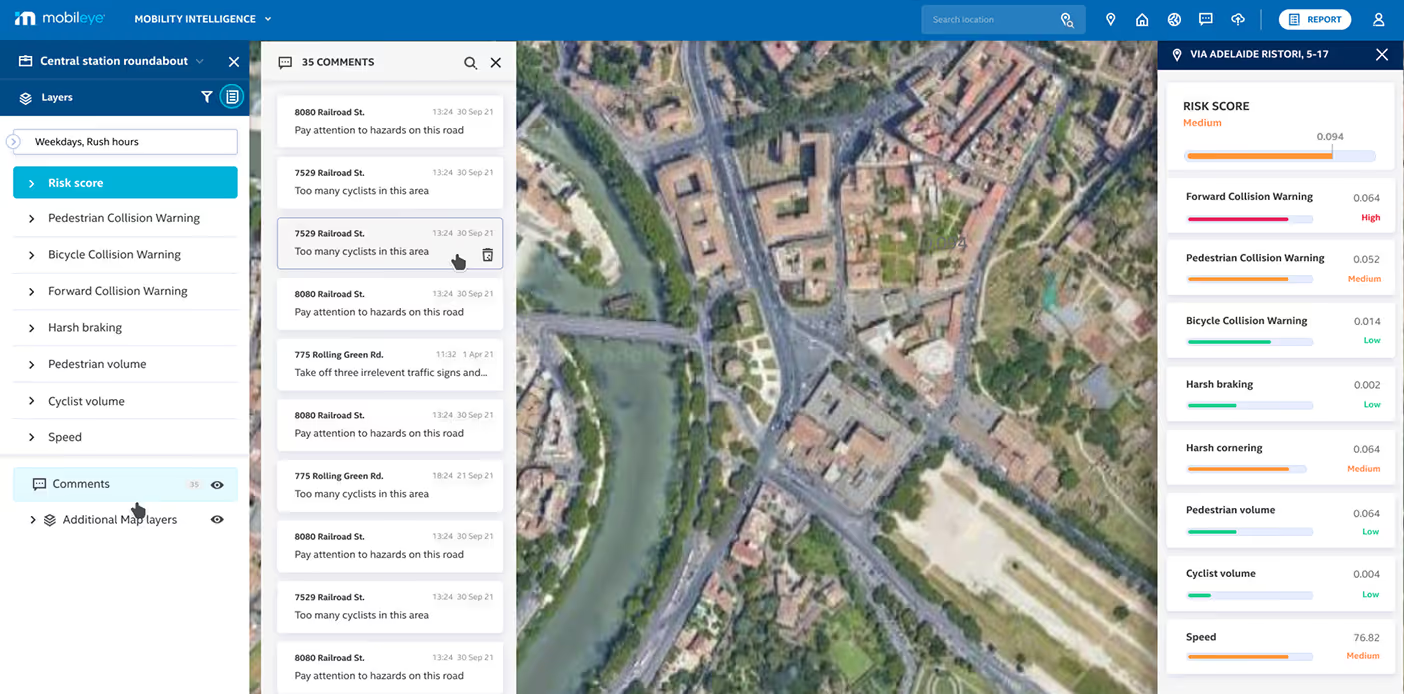
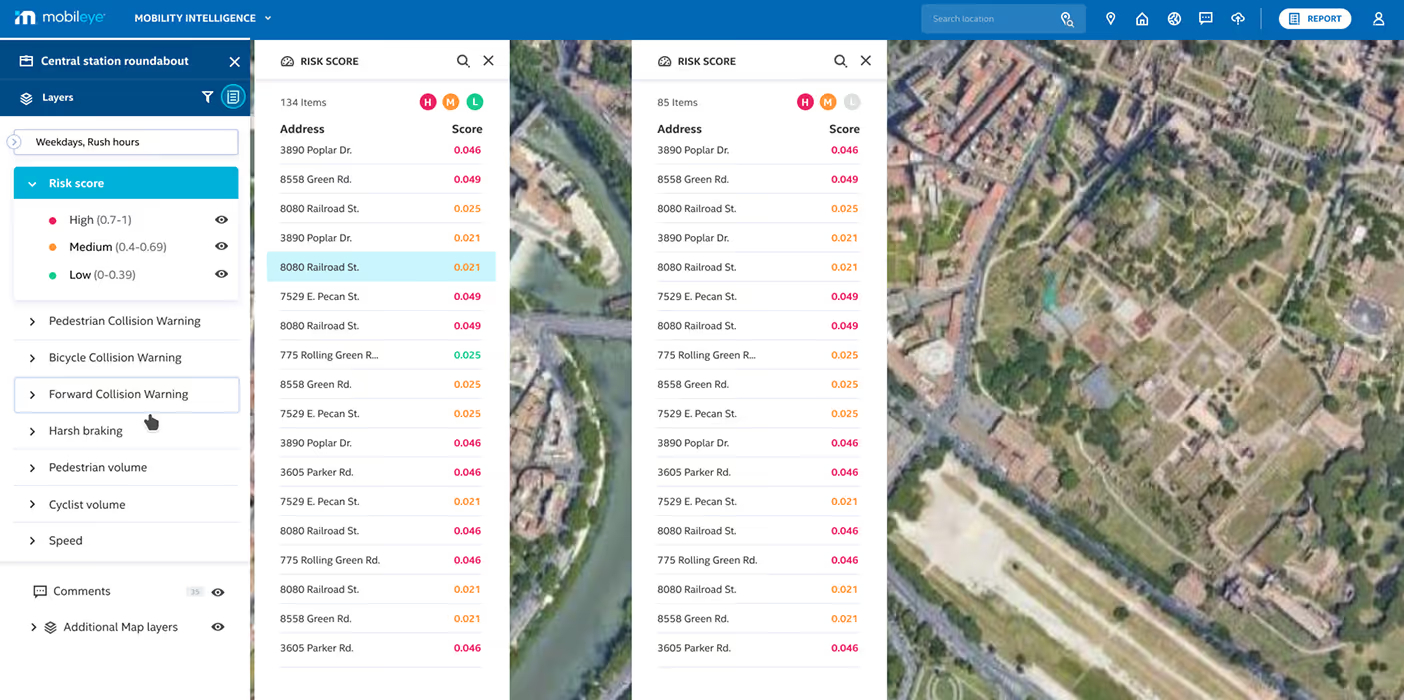
Dynamic risk scoring system
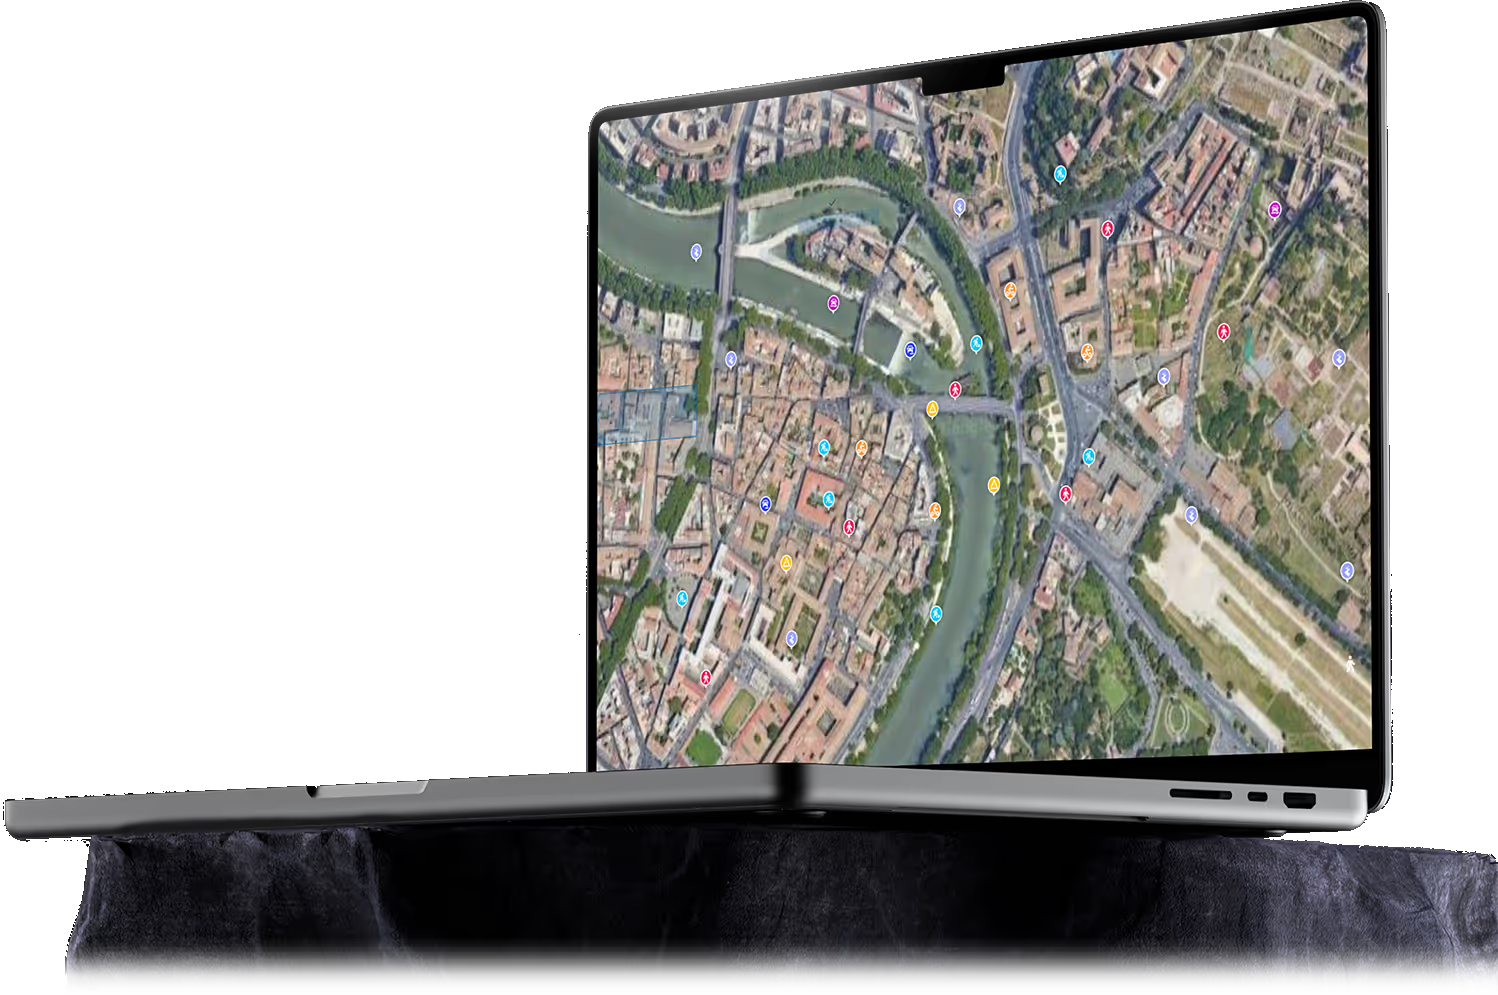
Integrated heatmaps to highlight high-risk areas.
Layer-based navigation
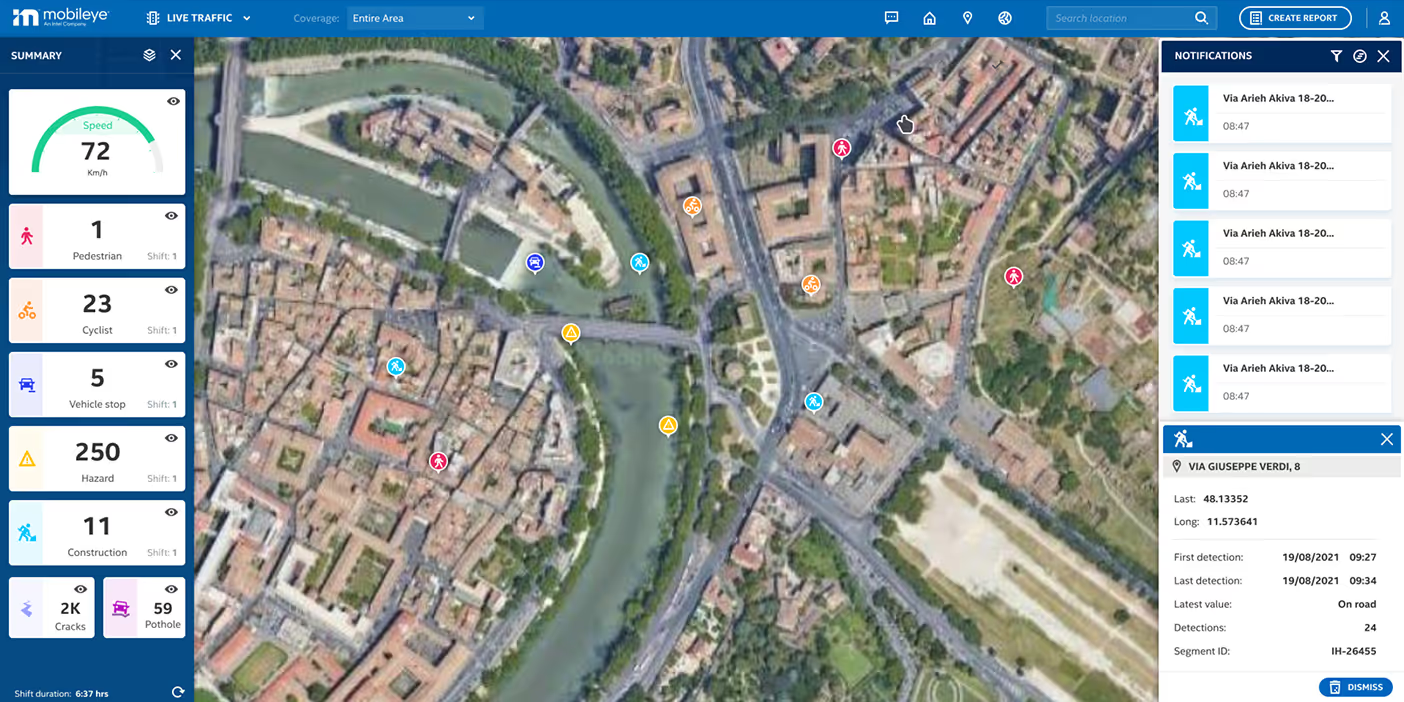
Users can toggle different data layers, including pedestrians, cyclists, and vehicle speed.
Informative color coding
Clear color mapping for risk levels (green = low, orange = medium, red = high).
Optimized reporting and data analysis
Smart data visualization with quick, focused report generation.
Enhanced interactivity
Interactive map elements, including address search, advanced filtering, and clickable points for additional insights.

USER PERSONA

Statement
"I need a seamless and intuitive system to analyze traffic data, identify risk zones, and make data-driven decisions to enhance urban mobility."
About
Aviv is a senior urban traffic engineer working for the Ministry of Transport and Road Safety in Israel. With over a decade of experience, he specializes in analyzing traffic flow, accident hotspots, and pedestrian safety measures. He frequently collaborates with city planners and policymakers to optimize infrastructure. Aviv needs a powerful yet user-friendly data visualization tool to streamline his decision-making process and improve urban mobility.
Personality
- Analytical
- Problem-Solver
- Tech-Savvy
- Detail-Oriented
- Strategic Thinker
- Data-Driven
Goals
- Gain real-time insights on traffic congestion.
Identify accident-prone areas with clear risk analytics. - Improve pedestrian and cyclist safety through data-driven strategies
- Generate automated reports with easy-to-read visualizations.
- Optimize traffic signal timing and city infrastructure planning
Frustrations
- Current tools present overwhelming raw data with no clear interpretation.
- Slow access to real-time mobility reports. Poor navigation in existing platforms.
- Difficulty integrating multiple data sources into one system.
- Inefficient collaboration features for working with city planners.
Design
Process
Understand
User Research, User Interview, Competitive Analysis
Define
User Personas, Empathy Map, User Journey
Ideate
User flow, Information Architecture
Design
Wireframe, HI-Fi Design, Prototype
Test
Feedbacks, Conclusion, Future Concept
.png)
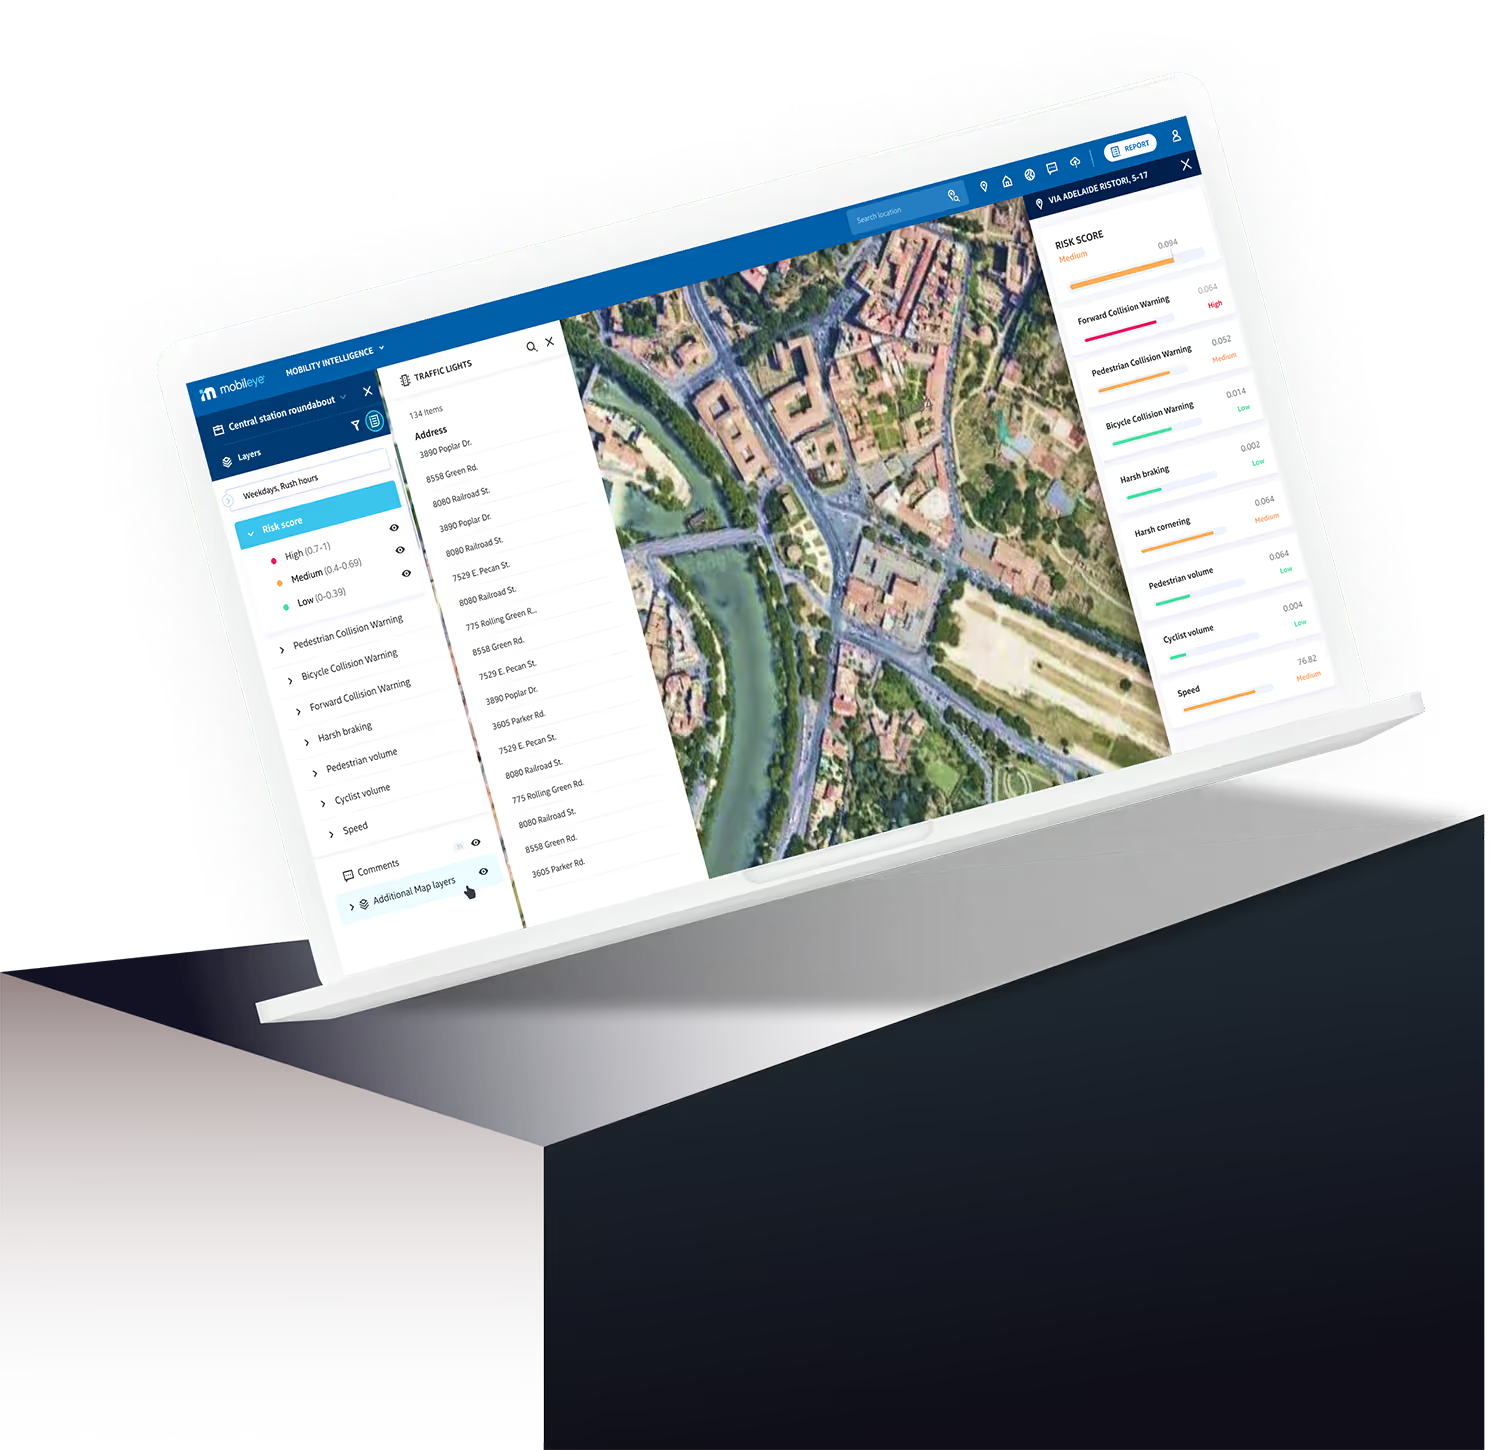
FINAL OUTCOME
& IMPACT
- Faster and smarter navigation – Reduced information retrieval time and improved workflow efficiency.
- Significant improvement in data readability – Quick and precise insights.
- Clear and interactive visualization system – Leveraged advanced technology for accessible data representation.
- Accessible to all user types – Simplified complex data, making it intuitive for non-technical users.
CONCLUSION
The redesigned Mobility Intelligence system delivers an intuitive, data-driven user experience, empowering urban planners and traffic engineers. The UI/UX enhancements ensure easier navigation, faster insights, and better decision-making to improve safety and mobility in cities.


.svg)